
“Broken Windows” theory argues that the mere perception of disorder in a neighborhood significantly increases crime in that area. George L. Kelling and James Q. Wilson’s seminal work, “Broken Windows”, provides the following example:
“Consider a building with a few broken windows. If the windows are not repaired, the tendency is for vandals to break a few more windows. Eventually, they may even break into the building, and if it’s unoccupied, perhaps become squatters or light fires inside.”
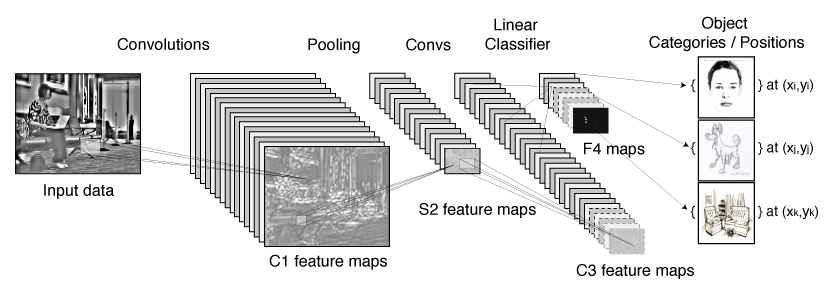
Since that first article in 1982, social scientists have designed extensive surveys and experiments to both validate and refute the “broken windows” hypothesis. Even before Killing and Wilson’s article, Philip Zimbardo, a psychologist from Stanford, empirically tested this theory by setting up abandoned automobiles with no license plates and observing how long it took the surrounding population began vandalizing the cars. Zimbardo eventually concluded that the initial abandonment precipitated the subsequent looting. Modern approaches for testing this theory involve designing longitudinal studies and creating econometric models to test the causal relationship between neighborhood disorder and actual crime. These approaches, however, require years of manual data collection. In addition to being time consuming, the causal models built to test the “broken windows” hypothesis require a great deal of statistical assumptions and instruments to control for other factors, e.g. demographics, income levels, unemployment rate, and others alike, that correlate with crime. These studies, however, fail to directly incorporate the primary modality of the theory, which are the “broken windows” themselves. In this project, we use street level images collected from Google’s Streetview API to predict crime rates in neighborhoods across Chicago and New York. Our approach directly tests the relationship between the overall the perception of safety in a given neighborhood and the crime levels in a given neighborhood. As prescribed by the “Broken Windows” hypothesis, high crime regions are associated with dilapidated businesses, abandoned buildings, and graffiti and vandalism. Our approach takes advantage of the state of the art results in deep learning and computer vision by applying a Convolutional Neural Network to classify high crime images from low crime images.
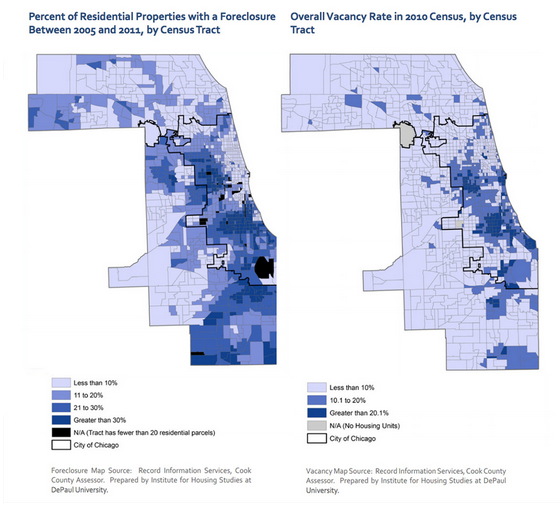
One of the main puzzles that continues to challenge criminologists is explaining the variations in crime and socioeconomic welfare between nearby areas in a given city. For example, in New York, while distinction between the Manhattan and South Bronx is a very subtle geographically, the number of homicides in the two regions paints a very different story. We can find a more salient of this problem example in Chicago (See Chicago Crime Map). In Chicago, the neighborhoods of Hyde Park and Woodlawn are only separated by a couple of blocks, but the median income in Hyde Park is nearly $15,000 higher and the number of monthly violent crimes in Woodlawn nearly triples the number in Hyde Park. The following map from the Urban Land Institute and the Institute for Housing Studies further reinforces this story as minor geographic differences often amount to significant differences in foreclosure and vacancy rate in the South Side of Chicago.
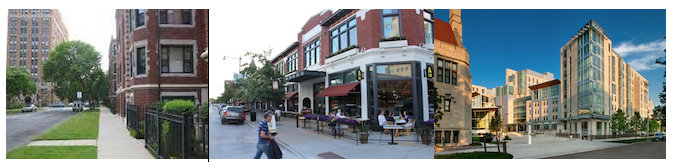
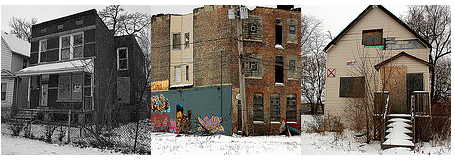
Although geographical distinction between Hyde Park and Woodlawn doesn’t always explain the underlying the fundamental differences in socioeconomics within large cities, it becomes much more apparent if you can simply walk around the area. To reinforce this idea, we randomly sampled few images from Hyde Park and Woodlawn. In Hyde Park, we see images of cafes, apartment buildings, and college residential halls. Meanwhile, Woodlawn images are comprised of graffiti and two homes that seems abandoned. In these images, the differences between the two bordering neighborhoods become extremely apparent.
Using this intuition, we were curious to see if we can see such clear differences across similar types of neighborhoods in Chicago and New York. However, it would be extremely time consuming for humans to manually inspect thousands of street view images. We can take advantage of the latest research in deep learning, which often performs as well as humans in Image classification tasks.
We downloaded nearly 250,000 street view images across New York and Chicago from Google’s Streetview API. For each image, we had the latitude and longitude coordinates, which allowed us to figure out whether the image was from a low crime, average crime, or high crime region. Using these labels for each of the images, we trained the the state of the art convolutional neural network on 70% of the images, while the remaining 30% was used to validate the effectiveness of our approach. Likewise, on the held out data, we were able to predict whether the image was from high, average, or low crime neighborhood with nearly 95% accuracy.
This demonstration thus provides promising results for applying deep learning algorithms to classify regions with high levels of crime. Not only does this have profound implications for how methodological research in the social sciences can be done, but it can potentially inform how to effectively distribute police in high crime areas. However, our convolutional neural network architecture is currently a black box that is unable to incorporate additional knowledge from human experts (police and social scientists). Police often have great deal of local expertise. Incorporating that information into this algorithm can not only improve its performance, but more importantly increase its application to more granular tasks such as more specific crimes or more local regions. In the next phase of this project, we will unravel the blackbox by visualizing the receptive fields that are being activated in the neural network architecture and build an online web application that will take user input to improve the algorithm’s performance.